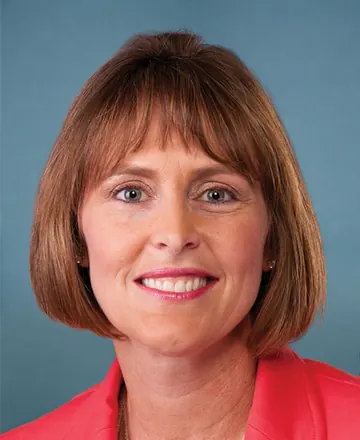
Polling
In the Florida 14th District
Job approval among adults in the district.
- Approve 34%
- Not sure 40%
- Disapprove 26%
Cooperative Election Study, 2024 and 2025 surveys, 181 respondents in the district, small-area estimate, margin of error ±9 points.
Year by year
Each year's Cooperative Election Study on its own, 2019 to 2025, same seat. Years with a margin of error over 10 points are left out.
| Survey | Approve | Disapprove | Not sure | Respondents | Margin |
|---|---|---|---|---|---|
| 2025 | 22% | 32% | 46% | 44 | ±10 |
| 2024 | 37% | 27% | 36% | 137 | ±8 |
| 2023 | 31% | 28% | 41% | 71 | ±8 |
| 2022 | 37% | 28% | 35% | 147 | ±8 |
| 2021 | 38% | 26% | 36% | 60 | ±8 |
| 2020 | 40% | 25% | 35% | 156 | ±7 |
| 2019 | 51% | 28% | 21% | 46 | ±9 |
In 2019 about half as many people answered "not sure" about every member as in later years, so approve and disapprove both run higher that year.